You are invited to participate in our study titled "A Validated Scale for Perceived Readability in Visualization".
Our goal is to develop a validated scale that researchers can use to let study participants rate the perceived readability of a visualization.
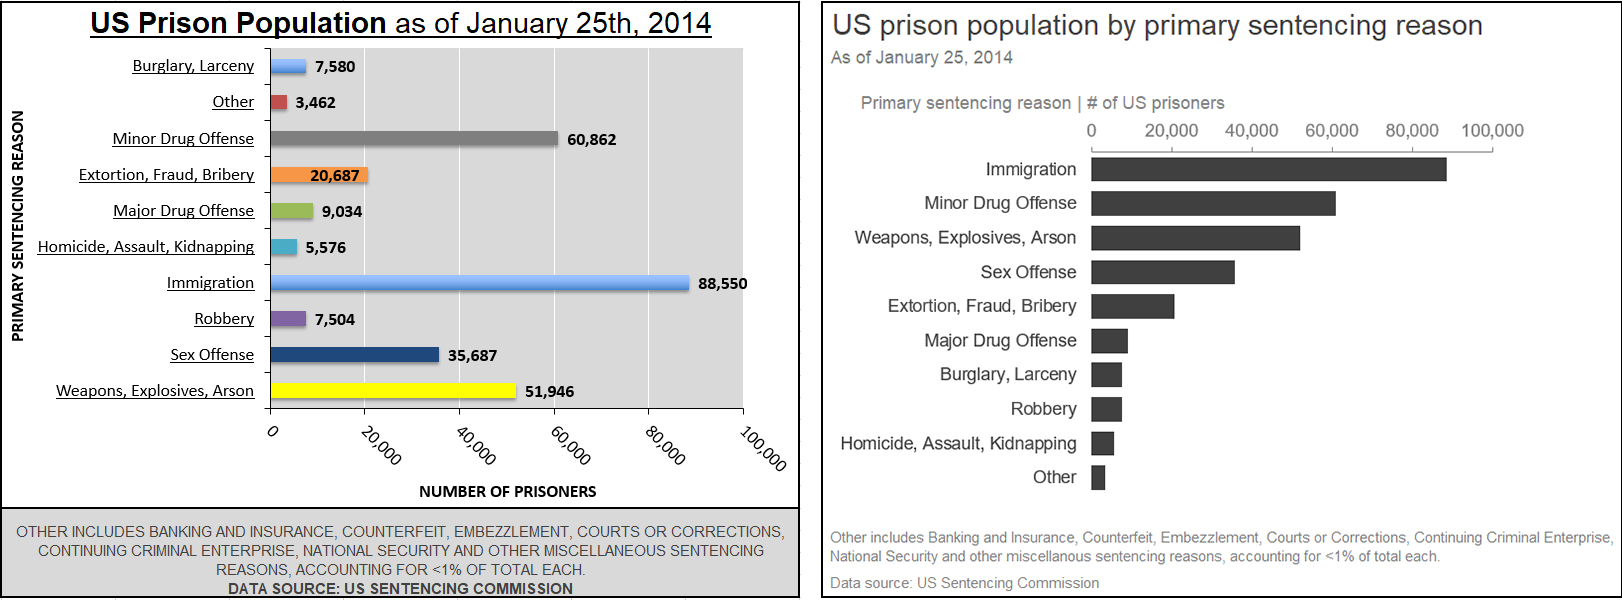
For example, regarding the two graphs below, researchers could ask one group of participants to rate the readability of the graph on the left, and another group to rate the graph on the right. The results would allow researchers to determine which one feels more readable, and to what extent.

Please respond to this survey only if you:
- are a fluent speaker of English,
- are of legal age (18 years in most countries), and
- don't have low vision or impaired vision, including any form of color deficiency.
This study is conducted by
Click "Next" if you are interested in further details about the study.